Generating a report
Every report in EyeOnTask is built the same way, whichever one you are after. This is that sequence, once.
Pick the type
Section titled “Pick the type”Add Report, at the top of the saved-report list, opens the catalogue: the report types the account can run, grouped into sections by what they are about — the fieldworker reports together, the invoice reports together, the inventory reports together.
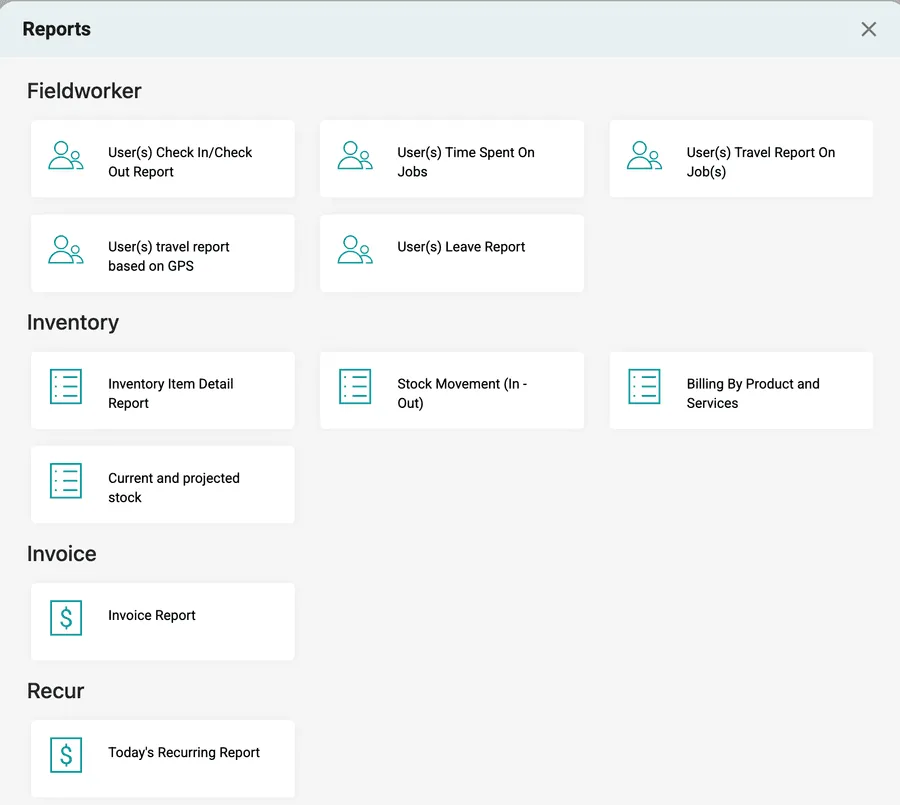
Reports → Add Report
The list runs further down than one screen: below these come the Job, Client, Equipment(s), Purchase Order and Supplier, Expenses, Email Log, Payment Received and Tax sections.
Picking one opens it with its filters empty and nothing generated yet.
Set the filters
Section titled “Set the filters”The filters sit in a row across the top of the report, and which ones appear depends on the type. A report about people asks who; a report about invoices asks which client and which invoice type.

Reports → Invoice Report
Two things are true of all of them:
- A red asterisk means the filter is required. The report will not generate until it has an answer, which is why a report that seems to do nothing when you press the button is usually a required filter left empty.
- Clear, beside a filter’s name, empties that one filter without disturbing the rest.
Date Range is on almost every report, and it takes a relative range — Last 30 Days, Last Month — rather than only two fixed dates. A relative range is what makes a report worth saving: Last 30 Days still means the last thirty days when the report runs itself next month, where a fixed pair of dates would go stale the day after it was set.
Choose the columns
Section titled “Choose the columns”Show Column decides which columns the result carries, and reports open with a sensible set already ticked.
It is worth turning columns off as well as on. Every column has to fit the width of the page, so a report carrying more than about ten of them prints with everything squeezed and truncated — the report warns you when you cross that line. On screen it only means scrolling; on paper it means a sheet nobody can read.
Generate it
Section titled “Generate it”Generate Report runs the report and draws the result underneath.
The result begins with its own heading, and that heading repeats the filters back: the dates it covers, who it covers, and the totals for the range. This is not decoration. A generated report is usually about to become a printout or a file on somebody else’s desk, and the heading is what tells that person what they are holding.
Below the heading is the table. Column headings carrying a sort arrow will re-sort the whole result on that column.
Changing a filter does not change the result underneath it — the table is the answer to the question as it was when you last pressed the button. Press Generate Report again after any change.
Take it out
Section titled “Take it out”
Reports → a generated report
Two buttons sit at the right of the result’s heading row, and both act on the result as generated, filters and all:
- Print lays the report out as a sheet.
- Export takes it out as a file, which is the route into a spreadsheet, a payroll system, or an accountant’s inbox.
If the same report is going to be wanted again — next week, or every week — save it rather than rebuilding it. See saved reports and auto email.